April 17, 2020
 By Clayton Johnson, Communications Manager, Pecan Street
The overall decline in energy demand due to COVID-19 shelter in place (SIP) orders has been widely reported in recent weeks. However, Pecan Street’s recent analysis shows that in contrast with the overall trend in declining energy demand, residential demand is up. Of course, this comes as no surprise, given the amount of time we’re all spending at home. But what are the cost implications for this increase, especially with warmer weather just around the corner?
Pecan Street’s database of home energy use allows us to answer some of these questions. With this unique dataset, we’ve set out to understand exactly how residential energy use is changing under shelter in place, how this will affect homeowner’s utility bills, and the potential grid impacts as temperatures continue to rise in the coming weeks.
Shifting energy use is already hitting wallets
We compared energy use data from 103 homes in our research network from March 2020 to the average usage from March 2017, 2018 and 2019. All of the homes examined are located in Austin, TX. This analysis allowed us to calculate the expected change in the utility bills for individual homes in our sample. For March 2020 we saw an 11.5% increase in overall energy use compared to the average from March 2017-19. This would result in a 9.3% increase in utility bills. However, from March 24 -28 (after shelter in place was put in effect), we saw a steep increase in energy use, with the average home using 32.7% more electricity than in previous years. And it’s reasonable to assume this higher demand will continue throughout shelter in place.
The nonlinear correlation between increased energy use and increased utility bills is due to Austin Energy’s tiered energy rates, which progressively increase the amount a customer is charged based on the amount of energy they use. In other words, a 20% increase in energy use could translate to significantly more than a 20% increase in a customer’s bill (if the increased usage is billed in a higher rate tier). These higher costs are likely to be exacerbated if Austin’s shelter in place is still in effect as temperatures and energy usage rise as we move into summer.
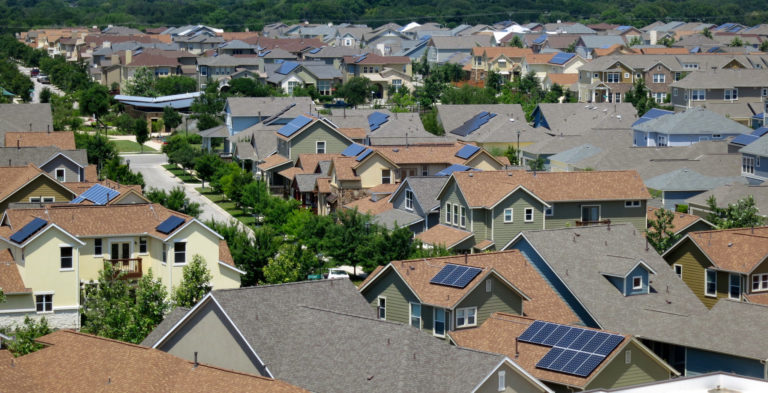
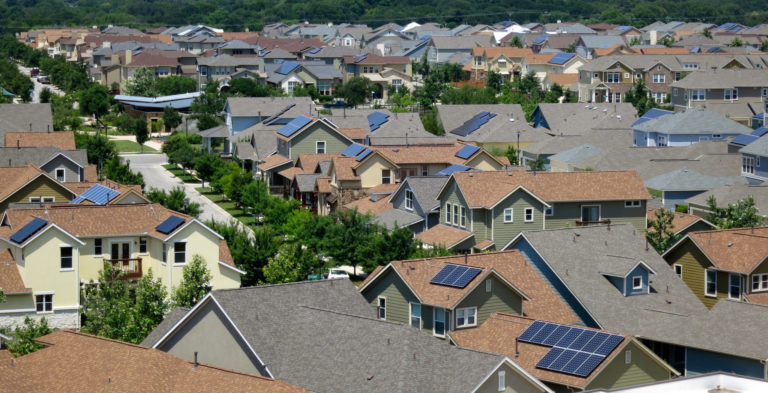
It’s important to note that the 103 homes we examined are located in Austin’s Mueller community, a modern mixed use development where all of the homes are less than 15 years old, and most of them are priced above the area’s median value. The trend we see with these homes would place an even greater burden on low to moderate income households, which typically contribute a much higher percentage of their monthly budgets to energy costs.
Weather’s Impact: As temperatures rise, so will utility bills
Weather is likely to be the factor with the greatest impact on energy demand and utility bills under shelter in place. Overall, Austin’s shelter in place order has coincided with relatively mild weather; however, our recent analysis shows a significant increase in energy use, and HVAC use specifically, even when accounting for variations in weather (based on cooling degree days). See our previous blog post for a more detailed discussion of this analysis.
To reiterate, this increase occurred during relatively mild temperatures. In contrast, Austinites know well what temperatures are in store for the coming months, and if shelter in place is still in effect and energy use behaviors remain the same, residential energy usage and utility bills could reach historic levels. The convergence of these factors is likely to disproportionately impact low to moderate income households, which tend to have less efficient homes and appliances, and a higher energy burden than the average home.
Utilities Step Up Assistance
In an effort to mitigate these concerns, many utilities, including Austin Energy, have announced measures to limit these financial impacts on homes and businesses. The Austin City Council approved a utility bill relief package that included a moratorium on disconnects, increased availability of payment arrangements, reduced regulatory charge, a cap on rates for higher tiers (over 1,000 kWh/month), and expanded support through the Customer Assistance Program (CAP) and Financial Support Plus 1 Program. To learn more about eligibility and how to take advantage of these programs, visit Austin Energy’s COVID-19 Emergency Response webpage here: https://austinenergy.com/ae/about/news/coa-bill-relief
What’s Next?
In the coming weeks we will be analyzing energy use and cost data for a full billing cycle under shelter in place in order to gain a better understanding of the full range of impacts. We also plan to work with other community partners, like the Texas Energy Poverty Research Institute (TEPRI) to take a deeper dive into the implications for low to moderate income households that already have an oversized energy cost burden. Check back soon for more updates!
Methodology Details
- We examined a subset of our participants that have been part of our network for several years.
- Our calculations include a total of 103 homes.
- In each of these homes, our sensor equipment measures demand as frequently as every second.
- All homes are located in one neighborhood in Austin, Texas.
- We examined the total demand for the month of March for each home. For historic comparison, we averaged the same figures from previous Marches (2017, 2018 and 2019).
- Note: Billing cycles may not align with month start/end dates.
Details about March 2020 in Austin Texas
- All of the homes included in these analyses are part of Pecan Street’s research network and are located in Austin, Texas.
- Austin experienced one of the country’s first high-profile COVID-related cancelations when SXSW was called off on March 6.
- Spring Break for many Central Texas school districts was March 16-20. Austin Independent School District canceled all classes on March 12, the last day before Spring Break, and has closed all school buildings and facilities until May.
- Austin’s shelter in place order was put into place on March 24th.
- March weather in Austin is extremely varied. March 2020 included dramatic swings of cool (60s) and warm (low 90s) high temperatures the entire month.


