April 7, 2020
The following story was published by Greentech Media. Pecan Street’s original blog post about increased energy use during Austin’s Stay Home – Work Safe order can be found here.
Solar, EV charging, and air conditioning use is changing with stay-at-home orders, data from researcher Pecan Street shows.
By Jeff St. John – April 7, 2020 – Greentech Media
As the coronavirus pandemic forces people across the country to shelter at home, utilities and grid operators are watching typical energy use patterns change in unpredictable ways, and trying to understand how this will affect their grid operations, power purchasing practices, and long-term plans.
Austin, Texas-based Pecan Street Inc. may have some answers. Over the month of March, the research group has been analyzing the second-by-second energy data from more than 100 homes in Austin’s Mueller neighborhood, as part of one of the world’s longest-running real-time home energy data collection efforts.
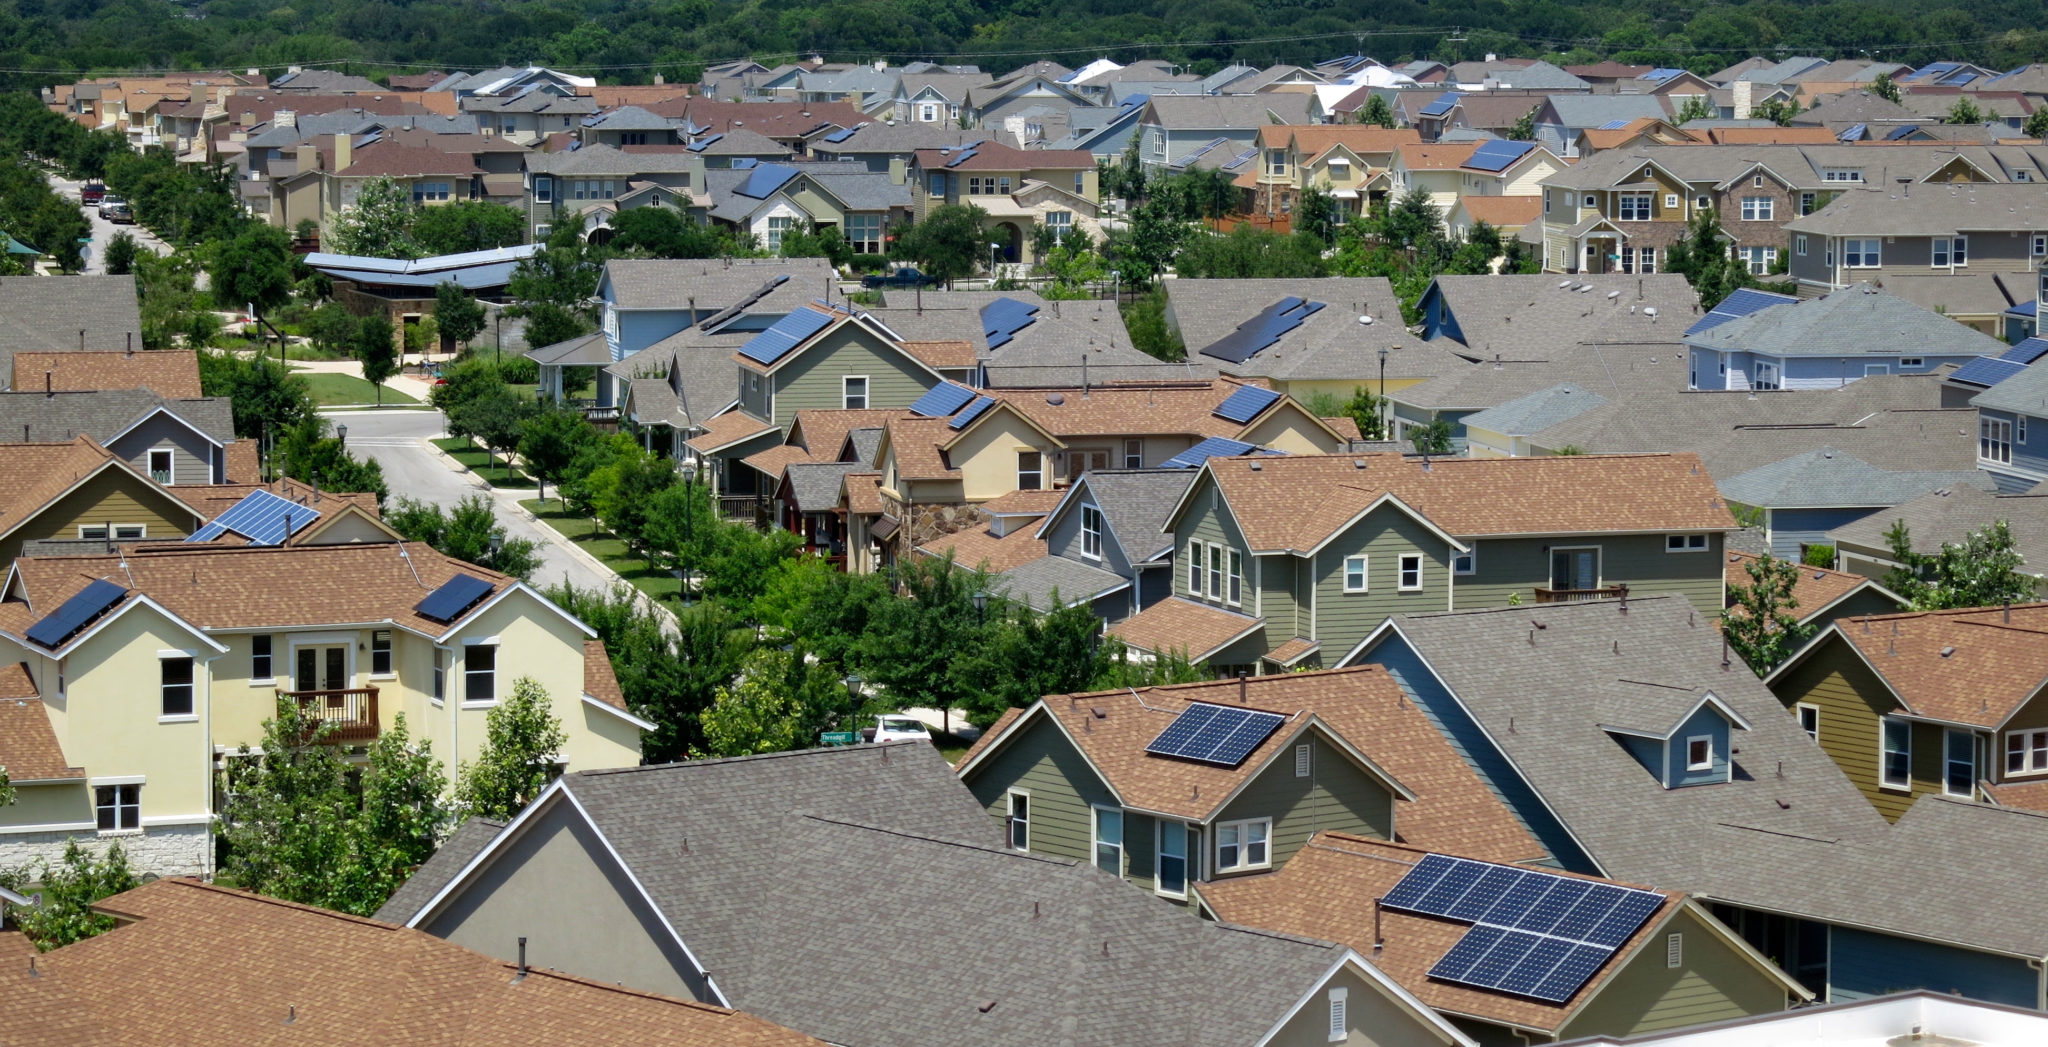
Many of these homes have rooftop solar panels, electric vehicle chargers and smart thermostats, making them valuable sources of information on how distributed energy resources (DERs) operate in concert. Now, they are offering a glimpse into how DER-equipped homeowners are changing the way they generate and consume energy when they’re stuck at home all day.
While the state of Texas hasn’t instituted a stay-at-home order, the city of Austin and surrounding Travis County ordered residents to shelter in place on March 24. Even before then, Austin canceled its South by Southwest festival on March 6, and closed its schools on March 12, putting residents on notice of the impending pandemic’s seriousness.
The resulting shifts in typical energy patterns have been illuminating, according to Scott Hinson, Pecan Street’s chief technology officer. “We know they’re not indicative of every household in America,” he said in an interview this week. “But it is illustrative of what happens when you tell people to stay home, stay cool, and stay productive.”
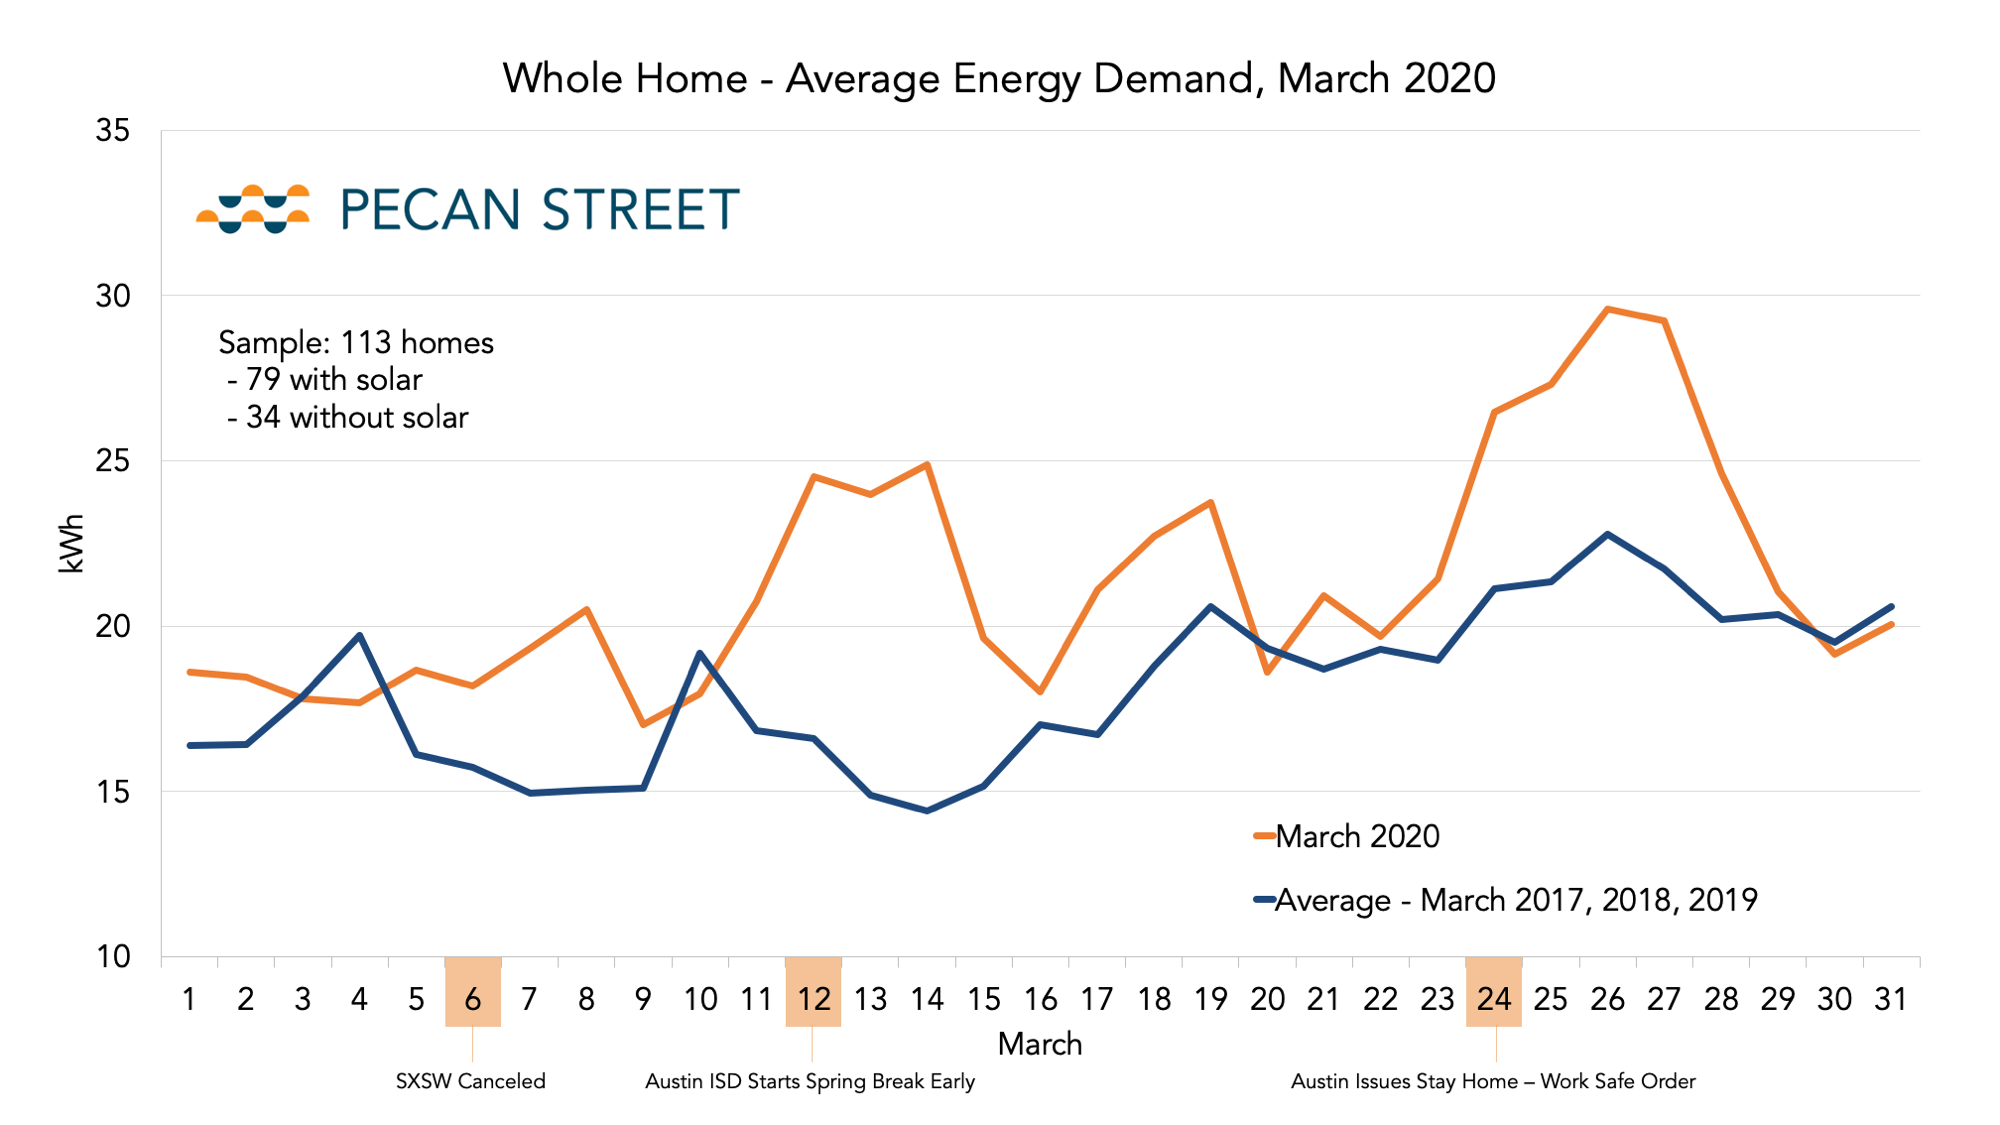
The first clear trend revealed by the data? Unsurprisingly, people staying home all day use significantly more energy — and in Texas, the biggest single driver of household energy use is air conditioning. The chart below shows how energy use this March spiked significantly compared to the average usage over the same month in the prior three years.
“This year, we’ve had a couple of hot spells, and you can see them clearly on the chart,” Hinson said, with the three spikes on the graph corresponding to days when temperatures jumped from the mid-60 degrees Fahrenheit to the high 80s and low 90s.
But the weather does not tell the full story: Even beyond those three spikes, “energy use went up more than it should have” compared to typical days when people are at work or school for most of the day, Hinson said.
By running the data through a “per cooling-degree day” calculation, Pecan Street estimates that air conditioner usage was up about 40 percent in the last week of March compared to historical averages. That could have implications for utilities trying to predict increases in AC energy demand under lockdown conditions as the country moves into warmer summer months.
The next big findings deal with the so-called solar ‘duck curve,’ which tracks the effect that solar generation has on typical energy supply-demand balance as it rises during daylight hours and fades away in late afternoon. In solar-rich states like California and Hawaii, the duck curve has led grid operators to curtail utility-scale solar power and take steps to restrict rooftop solar back-feeding onto distribution circuits.
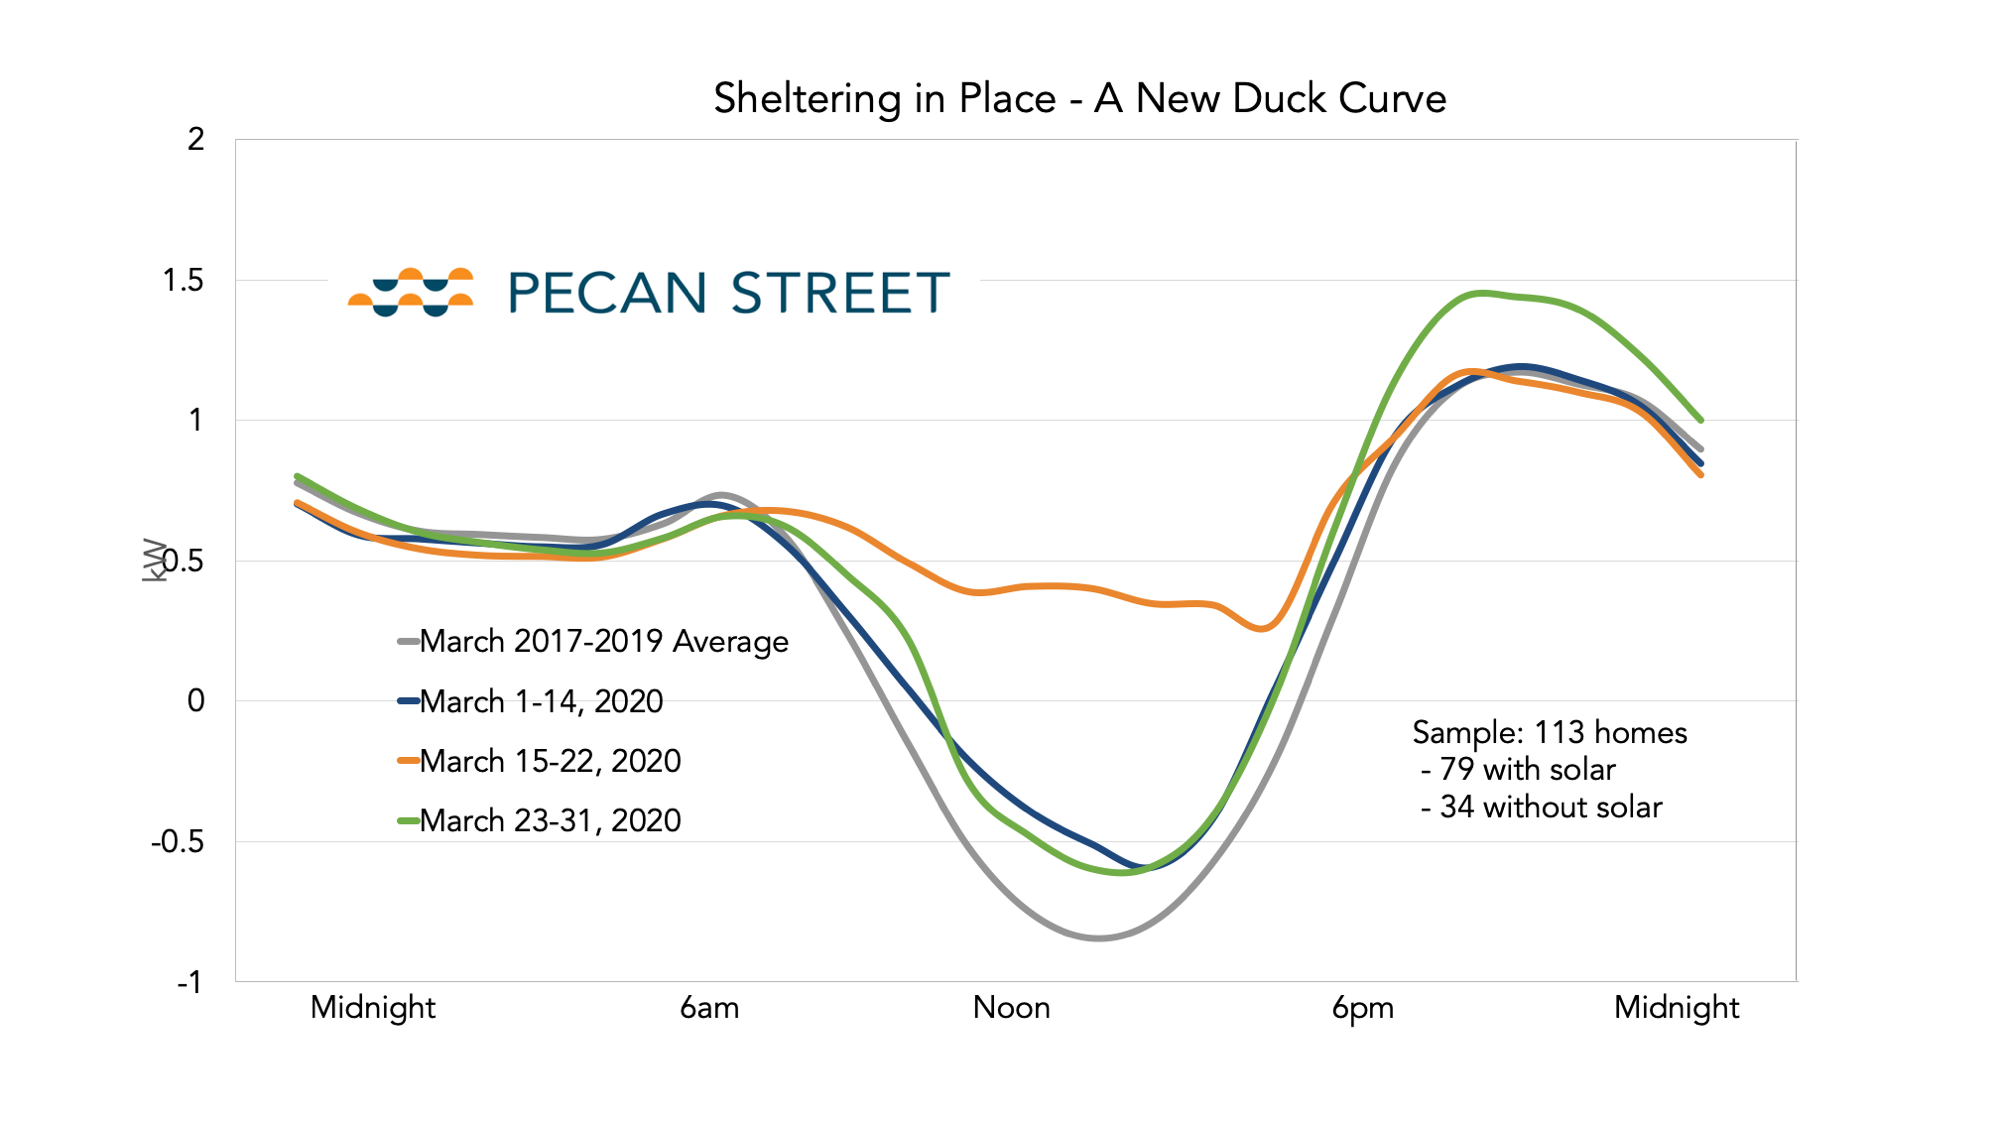
While Texas has much less rooftop solar than those states, Pecan Street’s participating homes have a lot more rooftop solar than the Texas average. That’s allowed it to track changes in the duck curve-like patterns emerging in the weeks before and after the city’s stay-at-home order compared to previous years, as this chart indicates.
Several key observations emerge from this data. The first two weeks of the month (the blue line) showed relatively little change compared to historical averages (the grey line).
Things got interesting during the week before stay-at-home orders but after school closures — shown with the orange line. There was a significant “flattening of the belly” of the duck curve, as higher temperatures led people at home to use much more of their self-generated solar power than usual.
Then, in the final week of March, when stay-at-home orders were in full effect, the typical duck curve reemerged, only with a slightly higher evening peak (the green line). Two factors likely drove this change, Hinson said. Average daily temperatures fell from their earlier peak, reducing air conditioner loads during the day — deepening the duck’s “belly” once again.
As for the steepening of the duck’s “neck,” Austin typically has a lively nightlife, but under lockdown people who might otherwise go out in the evening stayed home and increased their electricity use instead, Hinson said. It’s important to remember that this sample includes non-solar homes, he added.
Pecan Street’s EV charging data also indicates that people were driving their electric vehicles a lot less this March compared to historical averages — an expected result of the city’s response to the COVID-19 pandemic. The few spikes in the following graph are most likely tracking when Tesla owners were charging simultaneously.
Pecan Street has been sharing its data with municipal utility Austin Energy, which is involved in a federally funded research program to assess the grid value of solar power and battery energy storage. It’s also making it available to other utilities and research organizations, and to the general public via updated blog posts.
Suzanne Russo, Pecan Street’s CEO, pointed out that the data can help people make more informed decisions on how they manage their energy under these unusual circumstances. “As we get into the summertime, it’s helpful for people to understand how their choices at home are going to have a bigger impact on the grid, on their community, on emissions — and maybe think about some of the things they can do individually to help.”


