April 10, 2025
By Scott Hinson, chief technology officer, Pecan Street
Since we launched a decade ago, Pecan Street Inc. has significantly advanced the granularity, geographical scope and detail of residential energy data. And its availability to technology companies, utilities and researchers has helped speed innovation that strengthens the grid.
Key to this progress was our ability to collect data at 1-minute average intervals on every major circuit and appliance – when 15-minute whole home data was the standard of the day. One-minute data provides valuable insights into overall energy consumption patterns.
We then upgraded our data collection to 1-second intervals, adding current rms, reactive power, current THD and phase angle, which significantly improved data resolution and enabled more detailed analysis of energy usage patterns to aid in control algorithm and non-intrusive load monitoring development. With connected homes in 10 states and Puerto Rico, we have the world’s largest network of real-world residential electricity use.
Now, we’re taking the next big step. Our latest advancement involves sampling waveform data, capturing direct high-resolution measurements of voltage and current at the waveform level.
Understanding Waveform Data
“Waveform” refers to the graphical representation of voltage and current signals over time, typically viewed on an oscilloscope. Waveform data allows for detailed analysis of electrical loads, identification of specific device signatures, and detection of anomalies in electrical circuits. We now capture snapshots of this data regularly for a portion of our connected homes, in addition to our 1-second and 1-minute average data.
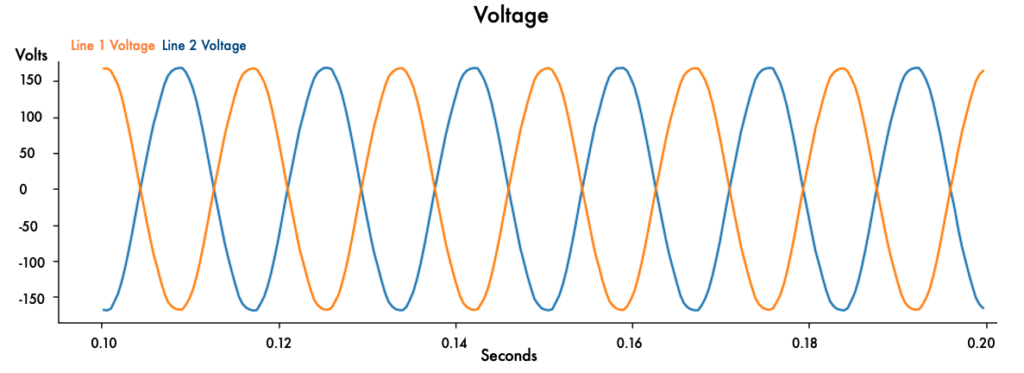
The voltage at the wall outlet is a sine wave. There are various standards on this, but in layman’s terms, it has to be a “very good” sine wave for the electrical grid to work. That’s not the case for the current. So what we want to see is this:
“Waveform” refers to the graphical representation of voltage and current signals over time, typically viewed on an oscilloscope. Waveform data allows for detailed analysis of electrical loads, identification of specific device signatures, and detection of anomalies in electrical circuits. We now capture snapshots of this data regularly for a portion of our connected homes, in addition to our 1-second and 1-minute average data.
The voltage at the wall outlet is a sine wave. There are various standards on this, but in layman’s terms, it has to be a “very good” sine wave for the electrical grid to work. This is what we want to see for voltage.
We want to see a similarly “perfect” sine wave for current, but we usually don’t. Below is waveform data from one of our connected homes, including each of the monitored circuits. You can see the measured current for each circuit is far from a perfect sine wave.
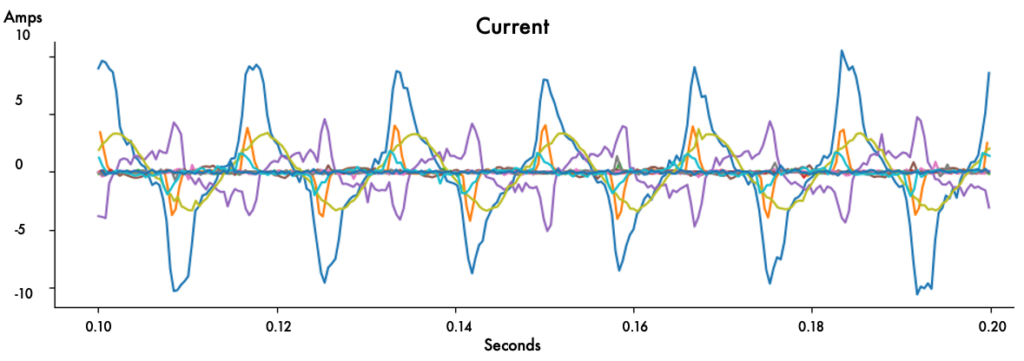
There’s a lot to be learned in those imperfect current waveforms, and now our dataset will include them.
We don’t know of any company or organization that is doing it, especially when you consider we collect waveform data for individual circuits, not just the whole home.
We talk a lot about the volume of data we generate from 1-second and 1-minute measurements, but the volume waveform data generates is incredible. For context, our 1-second data generates 5 data points per circuit per second. Waveform data generates about 2,000 data points per circuit every second every time we capture it.
Broad Application for Waveform Insight
We’re excited about this next data step not just because of its uniqueness but because it opens the door to a whole new level of insight and learning for a host of companies and engineers.
Inverter and Generator Manufacturers – Waveform data provides inverter and generator manufacturers with precise information on real-world electrical loads, enabling improved product design, optimized performance during power outages, and enhanced reliability in backup power scenarios.
Utilities and ISOs for Black Start Operations – Utilities and Independent System Operators (ISOs) can leverage waveform data to better understand actual residential load behaviors during system-wide outages. This facilitates more accurate modeling and quicker restoration of power through optimized black start procedures and cold load pickup in an era of distributed generation.
Technology Companies Studying Consumer Behavior – High-resolution waveform data allows technology companies to analyze consumer energy usage in unprecedented detail, enabling the development of targeted IoT products, energy-saving apps, and smart home solutions tailored to individual behaviors and needs.
Energy Companies Enhancing Disaggregation Techniques – Precise waveform data dramatically improves the accuracy of disaggregation methods, enabling energy companies to identify individual appliance usage. This leads to better-informed energy efficiency initiatives, more precise billing, and improved customer engagement
Cybersecurity and Anomaly Detection – By establishing detailed baseline waveforms for residential circuits, Pecan Street data can help detect subtle anomalies indicative of potential cybersecurity threats or operational issues. This capability enhances the overall security and reliability of residential energy systems and protects consumers and energy providers.
As more and more waveform data comes in, we’ll be posting new examples and insights. In the meantime, we’re ready to chat about how it can help you and your company. If you’d like a demo of our data capabilities or have any questions, don’t hesitate to reach out.